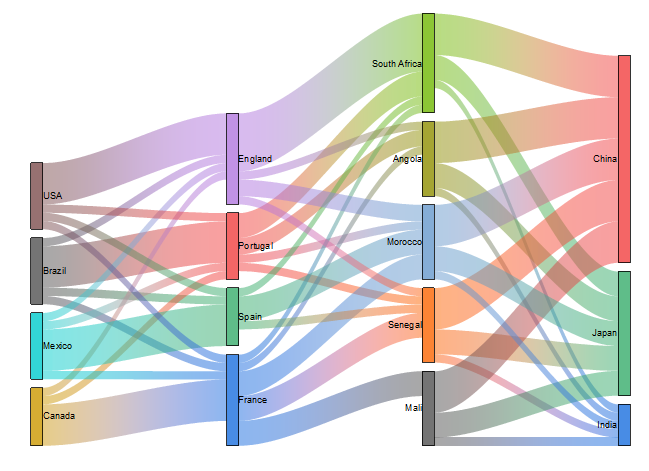
Sankey diagram
5
MENTIONS
3
EPISODES
3
PODCASTS
Search complete. 5 mentions across 3 episodes found for "Sankey diagram".
Oct 28, 2026

Evelyn StodghillGUEST
And then also the, uh,
Travis CoxHOST
the Sankey chart,
Evelyn StodghillGUEST
Sankey chart.
Evelyn StodghillGUEST
Yeah.
Evelyn StodghillGUEST
Yeah.
Evelyn StodghillGUEST
And then we use the Sankey chart as well.
Evelyn StodghillGUEST
And so, yep, that was good for just viewing all the CPU usage and alarms.
Evelyn StodghillGUEST
We also had it for that.

Klaus SchulteGUEST
Yeah, so y- you immediately see the impact from changing something in the code, um, to, to the, to the final result that you see here in Tableau.
Klaus SchulteGUEST
Um, and if you get to this stage, um, yeah, it will be super easy to, to, yeah, to further dig into this, um, and to create more advanced stuff, uh, maybe try a KPI card, uh, try a nice, uh, bespoke visual like, like a Sankey or something.
Klaus SchulteGUEST
And, and that will then just, uh, be very natural.
Klaus SchulteGUEST
And, and you can iterate with, with Codex, with Claude, um, and see the r- result here right away.

Phil HawthorneGUEST
It's amazing.
Phil HawthorneGUEST
But there is a cool Sankey chart, and it will show you, okay, this is how much electricity came in from the grid, and then it will branch off to each device.
Phil HawthorneGUEST
And you can actually see, and then you can see visually, all right, my air conditioner used 30% of my home use that day.
Phil HawthorneGUEST
And then you can start tweaking it with automations.