Relative strength index
219
MENTIONS
68
EPISODES
32
PODCASTS
Search complete. 219 mentions across 68 episodes found for "Relative strength index".
Nov 3, 2026

Dougie Fresh PicksGUEST
They love to bounce off of there, and they would love to go into the basement and go ripping right out.
Dougie Fresh PicksGUEST
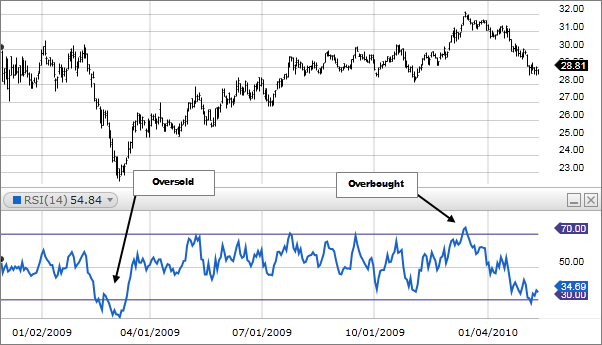
So if that, uh, if that RSI gets under that 30, it's at, like, 33 right now.
Dougie Fresh PicksGUEST
It gets under that 30 into the basement right there, and it gets under the 200, you know you're gonna have a wicked rip when it goes back up.
Dougie Fresh PicksGUEST
It's gonna be one great turnaround.
LG DoucetHOST
[laughs]
Dougie Fresh PicksGUEST
"Let's, let's analyze it after tomorrow and Wednesday." So It, it just kinda changed around as the market does so fast usually, but that's what it looks like.
LG DoucetHOST
What specific assets do you think would rip? Or like, what class of assets, right? 'Cause we're just looking at in- indexes, right? So what would, what would prop these back up on this like volatility swing the other way, RSI swing the other way?
Dougie Fresh PicksGUEST
Well, I think a, a big one would be like an MU, a Sandisk, something like that where you have, you know, your, uh, memory and your semiconductors can really get things changed around really fast.

Rick DucatGUEST
Excuse me for signs of trends slow down here.
Rick DucatGUEST
RSI 62.
Rick DucatGUEST
We are above the 50 midline, but we aren't making any notable new highs thus far.
Rick DucatGUEST
Look for that change as well for further bullishness.
Rick DucatGUEST
But we've seemed to bounce back somewhat here.
Rick DucatGUEST
So look for the bulls to push forward once more and recapture some of these other moving averages if you did have more of a upside bias here.
Rick DucatGUEST
When we look at RSI, we are above the 50 midline, a similar triangular shape forming with our momentum indicator here.
Rick DucatGUEST
So if we do crossover below that 50 midline, that would be more of a bearish type of move.

Stan EhrlichGUEST
So it's not necessarily the tool you have to use, it's how you use the tool.
Stan EhrlichGUEST
So I use RSI, it's a custom version.
Stan EhrlichGUEST
I don't look back 14 days, I look back less.
Stan EhrlichGUEST
I like a higher overbought condition and a lower oversold condition.
Stan EhrlichGUEST
And I tweak the representation of the RSI differently.
Stan EhrlichGUEST
It's certainly not a line chart anymore.
Stan EhrlichGUEST
I also like to know what the RSI high is on the high tick of the day, not on the close, not on the current quote.
Stan EhrlichGUEST
Did it get to my custom RSI level at any one point a tick or more during that day? If that's true, it's part of my setup.
Rick DucatGUEST
If we were to break below that and our trend line, our 21-day EMA in teal is around 983 for now.
Rick DucatGUEST
RSI did take a bit of a pause here.
Rick DucatGUEST
Our green upward sloping trend line was broken, but our short-term red downward sloping line also is broken too.
Rick DucatGUEST
We pushed above that level.
Rick DucatGUEST
Now we are back in the overbought area for now.
Rick DucatGUEST
level of 70 typically is suggestive of strengthen in trending markets here but I do notice that we have a little bit of divergence here at the same time as we are making higher highs in terms of price RSI is not following suit here so not exactly what you want to see a bit of a mismatch between the pace of the gains in the actual price action here so now we can see that our volume profile gives us a node To watch kind of a spread out area between 975 to 1010.
Rick DucatGUEST
Very little to the upside here to watch out for in terms of notable trading activities, perhaps around 1040 and 1070 or so.
Rick DucatGUEST
But those are very small relative to the rest of what we see on our volume profile.
Rick DucatGUEST
We also dropped below our 21 and 5-day exponential moving averages, which were roughly in confluence near the low 190s.
Rick DucatGUEST
RSI also has taken a tumble here.
Rick DucatGUEST
We are below the 50 midline with a downward sloping trajectory as well on our momentum indicator.
Rick DucatGUEST
When we think about our volume profile study, we can see that the notable volume areas near our current activity, 172 to 188 is where much of the trading activity comes in.

Lance RobertsHOST
So.
Lance RobertsHOST
Relative strength, again, this is kind of a technical indicator, but when RSI is above 70, that suggests that whatever sector, stock, or market you're looking at tends to be overbought.
Lance RobertsHOST
You start getting up towards 80 or above 80, markets are extremely overbought.
Lance RobertsHOST
So once you get above 70, that's kind of the overbought.
Lance RobertsHOST
Below 30, between 30 and 20, Stocks, markets, or sectors are extremely oversold.
Lance RobertsHOST
Well, the tech RSI is sitting right close to 30.
Lance RobertsHOST
We're just a little bit above 30 right now as of October 16th.
Lance RobertsHOST
And so that's where we kind of met that oversold condition.

Tony EdwardHOST
That's possible in a bull market and the market moves in phases.
Tony EdwardHOST
So one of the things we've been monitoring is on the daily chart, we see the RSI is approaching the oversold zone.
Tony EdwardHOST
So naturally, we can expect a bounce.
Tony EdwardHOST
Now, it doesn't mean it has to go to the oversold zone, but we are seeing a bit of a bounce right now.
Tony EdwardHOST
But I don't believe, you know, many bears are calling for $30,000, $40,000, all these things, right? Because they're shorting.
Tony EdwardHOST
But the point is, is Bitcoin holding the support levels? Are there higher highs and higher lows? Yes, those things are in place.
Tony EdwardHOST
And as mentioned, the RSI approaching the oversold zone, MACD shows good.
Tony EdwardHOST
bears are losing momentum.

Lance RobertsHOST
So.
Lance RobertsHOST
Relative strength, again, this is kind of a technical indicator, but when RSI is above 70, that suggests that whatever sector, stock, or market you're looking at tends to be overbought.
Lance RobertsHOST
You start getting up towards 80 or above 80, markets are extremely overbought.
Lance RobertsHOST
So once you get above 70, that's kind of the overbought.
Lance RobertsHOST
Below 30, between 30 and 20, Stocks, markets, or sectors are extremely oversold.
Lance RobertsHOST
Well, the tech RSI is sitting right close to 30.
Lance RobertsHOST
We're just a little bit above 30 right now as of October 16th.
Lance RobertsHOST
And so that's where we kind of met that oversold condition.
Kevin GreenCORRESPONDENT
And technically, it's making higher highs, higher low.
Kevin GreenCORRESPONDENT
RSI is doing the same.
Kevin GreenCORRESPONDENT
MACD in a bullish formation.
Kevin GreenCORRESPONDENT
The thesis doesn't change from what we talked about this time last week.
Kevin GreenCORRESPONDENT
This pattern that we see to the left is the same that we have right now in that other box to the right here.
Kevin GreenCORRESPONDENT
Now, here's the reason why I get a little bit more bearish.
Kevin GreenCORRESPONDENT
RSI making lower highs, MACD bearish formation.
Kevin GreenCORRESPONDENT
50-week moving average has to hold, but if you're looking at a short-term bounce and that hammer candle holds on the daily chart, I would not be surprised if you see some follow-through and at least a retest and a 200-day moving average to kick off for next week.

speaker_0HOST
Okay, like the moving average.
speaker_1HOST
Or the RSI.
speaker_1HOST
Yes.
speaker_1HOST
Yes.
speaker_1HOST
Indicators digitize that subjective human psychology into objective mathematical formulas.
speaker_0HOST
Ah, I see.
speaker_1HOST
Take the RSI, the relative strength index.
speaker_1HOST
It's just a formula that measures the speed and change of price movements on a scale from zero to 100.
58 more episodes mention Relative strength index.
Create an account to see the whole feed, search across every transcript, and follow the entities you care about.