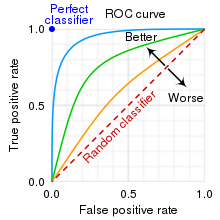
Receiver operating characteristic
25
MENTIONS
13
EPISODES
12
PODCASTS
Search complete. 25 mentions across 13 episodes found for "Receiver operating characteristic".
Sep 12, 2026

CornHOST
The only way to improve both is a better test, not a different cutoff on the same one.
Herman PoppleberryHOST
And if you want one number that combines both, you look at the area under the ROC curve, the AUC.
Herman PoppleberryHOST
0.5 is no better than flipping a coin.
Herman PoppleberryHOST
1.0 is perfect.
Herman PoppleberryHOST
Above 0.8 is generally considered clinically useful.
Herman PoppleberryHOST
Below that, limited utility.
Herman PoppleberryHOST
But AUC hides the threshold question.
Herman PoppleberryHOST
Two tests can have the same AUC and behave very differently at the cutoff a doctor actually uses.
CornHOST
There's an April preprint on automated detection of congenital heart disease from phonocardiograms in children.
CornHOST
751 subjects, 92% accuracy, AUROC of 96.
CornHOST
And a Bangladesh study with 990 children, where non-physicians recorded usable heart sounds in 87.6% of cases, most within 5 minutes.
Herman PoppleberryHOST
That Bangladesh study is the one that should change how people think about this.

Vadim GordonGUEST
And by late summer, he had, um, he had his, like, uh, his retrospective model outscoring the, like, whatever the statistical test is for that, like, accuracy-
Christian PayanHOST
The AUROC.
Christian PayanHOST
Sure
Vadim GordonGUEST
... we can, we can, we, we, we can guess how this, how this, uh, cancer's gonna come back, and that's what we'll use to choose our, like, our treatment, uh, for, for oncologists.

Juan HernandezGUEST
That's like weird.
Juan HernandezGUEST
Like, why would you, why would you select those features? And so, so a lot of, a lot of what we spent time on in like the last year is, you know, it's not purely like a black box model to like maximize ROC AUC.
Juan HernandezGUEST
There is like a little tiny bit of like shift that you get from like, you know, the, the, sorry, I use a technical term.
Juan HernandezGUEST
I'm sure a lot of people listening know what it is.

speaker_0HOST
The paper shows that WVNet excels when you are severely constrained by data scarcity.
speaker_0HOST
In the classification task, WVNet achieved above an, a .85 AUROC with as few as 100 labeled samples.
speaker_1HOST
Which is incredible.
speaker_0HOST
Hundred.

Jeremy TomlinsonGUEST
And other scores, APRI and NAFL fibrosis score, again, use composites of routinely measured biochemical and anthropometric measures to try and make a non-invasive assessment of your risk of fibrosis.
Jeremy TomlinsonGUEST
And you can see the ROC analysis here presented on the two curves showing how well they perform.
Jeremy TomlinsonGUEST
And I think the take-home message from this is that they perform reasonably well with areas under the curves of approximately sort of point eight, but none of them are perfect tests to be able to identify those patients with fibrosis.
Jeremy TomlinsonGUEST
One of the most detailed or comprehensive assessments has been, uh, provided by the LITMUS Consortium, which has used a constellation of non-invasive liver markers compared against patients that have had liver biopsy.
Jeremy TomlinsonGUEST
And you can see here in the graph here showing the area under the curve for the ROC analysis and the dotted line really representing that threshold of point eight where we think there is clinical utility in, in the test.
Jeremy TomlinsonGUEST
The take-home message I think you can see from this, and you can see both the, the VCTE as well as the FIB-four, is that they all perform to a similar fashion and none of them are perfect.
Jeremy TomlinsonGUEST
And again, specifically in patients with diabetes, you can see the ROC curve there on the right-hand side.
Jeremy TomlinsonGUEST
And again, the area under the curve for the ROC curves in parallel with the AUCs from the, um, from the, the bar graph are all approximately point eight and similar across many of these non-invasive tests.

Jeremy TomlinsonGUEST
And other scores, APRI and NAFL fibrosis score, again, use composites of routinely measured biochemical and anthropometric measures to try and make a non-invasive assessment of your risk of fibrosis.
Jeremy TomlinsonGUEST
And you can see the ROC analysis here presented on the two curves showing how well they perform.
Jeremy TomlinsonGUEST
And I think the take-home message from this is that they perform reasonably well with areas under the curves of approximately sort of point eight, but none of them are perfect tests to be able to identify those patients with fibrosis.
Jeremy TomlinsonGUEST
One of the most detailed or comprehensive assessments has been, uh, provided by the LITMUS Consortium, which has used a constellation of non-invasive liver markers compared against patients that have had liver biopsy.
Jeremy TomlinsonGUEST
And you can see here in the graph here, showing the area under the curve for the ROC analysis and the dotted line really representing that threshold of point eight where we think there is clinical utility in, in the test.
Jeremy TomlinsonGUEST
The take-home message I think you can see from this, and you can see both the, the VCTE as well as the FIB-four, is that they all perform to a similar fashion, and none of them are perfect.
Jeremy TomlinsonGUEST
And again, specifically in patients with diabetes, you can see the ROC curve there on the right-hand side.
Jeremy TomlinsonGUEST
And again, the area under the curve for the ROC curves in parallel with the AUCs from the, um, from the, the bar graph are all approximately point eight and similar across many of these non-invasive tests.

Jeremy TomlinsonGUEST
And other scores, APRI and NAFAL fibrosis score, again, use composites of routinely measured biochemical and anthropometric measures to try and make a non-invasive assessment of your risk of fibrosis.
Jeremy TomlinsonGUEST
And you can see the ROC analysis here presented on the two curves showing how well they perform.
Jeremy TomlinsonGUEST
And I think the take-home message from this is that they perform reasonably well with areas under the curves of approximately 0.8.
Jeremy TomlinsonGUEST
But none of them are perfect tests to be able to identify those patients with fibrosis.
Jeremy TomlinsonGUEST
One of the most detailed or comprehensive assessments has been provided by the Litmus Consortium, which has used a constellation of non-invasive liver markers compared against patients that have had liver biopsy.
Jeremy TomlinsonGUEST
And you can see here in the graph here, showing the area under the curve for the ROC analysis and the dotted line really representing that threshold of 0.8, where we think there is clinical utility in the test.
Jeremy TomlinsonGUEST
The take-home message I think you can see from this, and you can see both the VCTE as well as the FIB4, is that they all perform to a similar fashion, and none of them are perfect.
Jeremy TomlinsonGUEST
And again, specifically in patients with diabetes, you can see the rock curve there on the right-hand side.

Jeremy TomlinsonGUEST
And other scores, APRI and NAFAL fibrosis score, again, use composites of routinely measured biochemical and anthropometric measures to try and make a non-invasive assessment of your risk of fibrosis.
Jeremy TomlinsonGUEST
And you can see the ROC analysis here presented on the two curves showing how well they perform.
Jeremy TomlinsonGUEST
And I think the take-home message from this is that they perform reasonably well with areas under the curves of approximately 0.8.
Jeremy TomlinsonGUEST
But none of them are perfect tests to be able to identify those patients with fibrosis.
Jeremy TomlinsonGUEST
One of the most detailed or comprehensive assessments has been provided by the Litmus Consortium, which has used a constellation of non-invasive liver markers compared against patients that have had liver biopsy.
Jeremy TomlinsonGUEST
And you can see here in the graph here, showing the area under the curve for the ROC analysis and the dotted line really representing that threshold of 0.8, where we think there is clinical utility in the test.
Jeremy TomlinsonGUEST
The take-home message I think you can see from this, and you can see both the VCTE as well as the FIB4, is that they all perform to a similar fashion, and none of them are perfect.
Jeremy TomlinsonGUEST
And again, specifically in patients with diabetes, you can see the rock curve there on the right-hand side.
3 more episodes mention Receiver operating characteristic.
Create an account to see the whole feed, search across every transcript, and follow the entities you care about.